Usage recommendations
In this article:
Usage recommendations#
This section provides guidelines for using logging services.
ELK#
Service launch options#
Standalone caching instance in the selected Availability Zone
High-availability service deployed in a cluster of three instances minimum in three Availability Zones.
High-availability solution architecture#
High-availability ELK service is deployed in a cluster of at least three instances. Each node has one Elasticsearch master and one replica, and the latter interacts with a master from another node (cross-replication).
One of the cluster nodes can act as an arbitrator and will therefore have the master and voting_only roles. Absence of the data and ingest roles in this case prevents Elasticsearch from accepting and processing data. Moreover, Kibana and Logstash components are not installed on such node. Instead, such node does not require many resources, so you can use a cheaper instance type as an arbitrator.
If a cluster has at least two fully-functional nodes, then by default new Elasticsearch indexes are created with one primary shard and one replica. Sharding and replication allow you to preserve data if one of the nodes fails and distribute the load if it increases.
Authentication in ELK#
You can protect your login to the Kibana GUI or Elasticsearch API with a password which you can set when creating a service. Once the service has been started, it is not recommended to change the set password, otherwise it would become impossible to manage the installed service in the cloud.
For convenience, service users are built into the service:
kibana_system
logstash_system
beats_system
apm_system
remote_monitoring_user
Important
Changing the service passwords after the ELK start will cause the service to fail. If you want to change passwords, create new users with the same roles, set the passwords, and use them for integration with external systems.
Logging your own systems#
If the logging option was enabled for the PaaS service at its creation, then agents sending event logs (log shippers) are installed and configured in a fully automatic manner. However, you can also send event logs from your other non-PaaS systems to ELK.
You can choose whether to send logs to Logstash or directly to Elasticsearch. We recommend using Logstash with default settings: it is suitable for most situations and allows you to perform additional log processing using pipelines.
To collect logs on an instance with a logged system, install an agent, for example, Filebeat.
Sending logs to Logstash#
To send event logs to Logstash, add the following text to the Filebeat configuration file:
output:
  logstash:
   hosts:
   - 172.24.19.223:5044
   - 172.24.19.224:5044
There is no need to configure authentication on the agent side.
Sending logs to Elasticsearch#
To send event logs directly to Elasticsearch, configure authentication first. On the agent side, configure one of the following authentication types:
basic authentication using login and password;
token-based authentication.
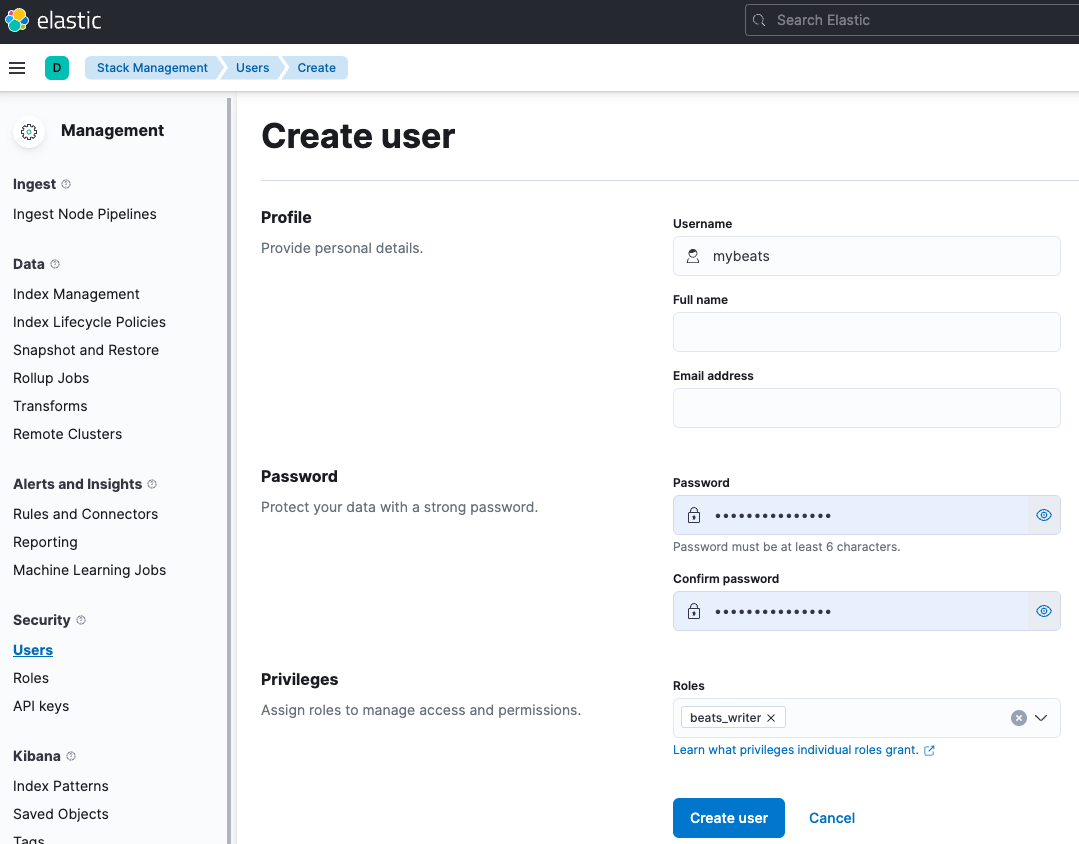
In case of the basic authentication, create a custom user and assign him/her the beats_writer role. To do this, use Elasticsearch API:
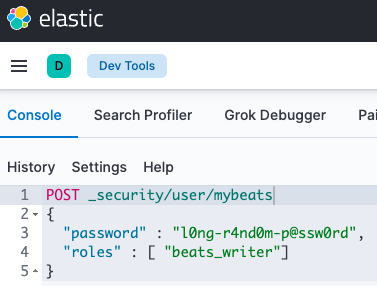
or in the Stack Management Users section:
Then, specify the username and password in the Filebeat configuration file.
output:
  elasticsearch:
    hosts:
    - http://172.24.19.223:9200
    - http://172.24.19.224:9200
    username: mybeats
    password: l0ng-r4nd0m-p@ssw0rd
Connection to the service#
After the successful launch, addresses and ports listened by ELK can be found on its page in the Information tab.
By default, ELK components listen to the following ports:
Component |
Protocol |
Port |
Comment |
|---|---|---|---|
Elasticsearch |
TCP |
9200 |
Receives HTTP requests |
Kibana |
TCP |
5601 |
Receives HTTP requests |
Logstash |
TCP |
5044 |
Uses its own Limberjack protocol and does not accept HTTP |
When working with Elasticsearch component, it is recommended to use endpoints to connect all nodes except for the arbitrator. Many tools such as Filebeat and Metricbeat are able to work with all endpoints at once, balance and switch automatically. If they fail to perform these operations on their own, we recommend using a haproxy or nginx balancer.
If you set elastic superuser password at the service deployment stage, Elasticsearch will start with X-Pack Security extension and any actions with it will require authentication.
Important
We recommend using the elastic account only to manage Elasticsearch component. To integrate with other services, create additional users with the required set of privileges.
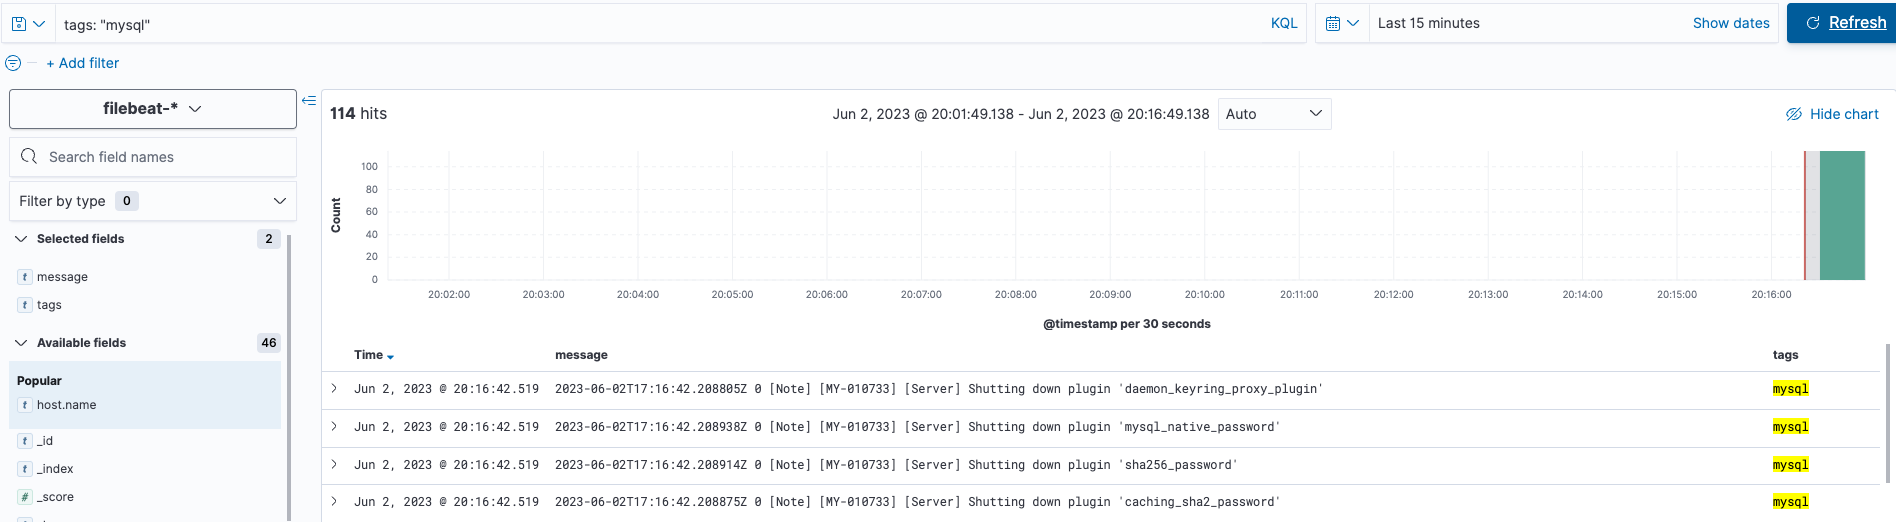
Log filtering using tags#
ELK service uses Kibana’s tagging capability to tag activity logs. The logs of each PaaS service are assigned a predefined tag. In addition, each log is assigned a tag according to the user-specified PaaS name. You can also add tags for a particular service yourself when creating it.
The table below shows tags for various PaaS services.
PaaS service |
Tag |
|---|---|
MySQL |
mysql |
PostgreSQL |
postgresql |
Redis |
redis |
MongoDB |
mongodb |
Memcached |
memcached |
ElasticSearch |
elasticsearch |
ELK |
elasticsearch / logstash / kibana |
Tags are helpful in filtering records in Kibana. The figure below shows how to select MySQL service logs using a tag query.
Service monitoring#
To check the state and health of instances with the service deployed, use the elasticsearch_exporter. The latter is installed with the ELK service and listens to tcp/9114 port. Additionally, the node_exporter, which listens to tcp/9304 port, is installed on all instances. It allows you to obtain instance and operating system metrics.